
The mimoCall Performance Monitor provides detailed real-time statistics for each active mimoCall connection, helping you evaluate connection quality and diagnose network or performance issues during a live session.
Opening the Performance Monitor
You can open the Performance Monitor once a mimoCall connection is established with a guest.
To access it select the mimoCall Source in the Sources list. and click the action icon. A separate panel will appear showing detailed incoming and outgoing data for both audio and video streams.
Overview
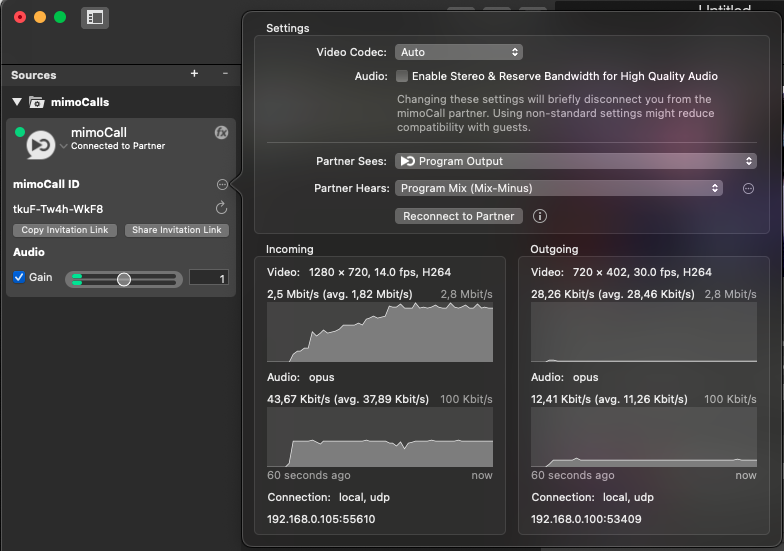
The Performance Monitor is divided into several sections:
Settings
- You can set the Video Codec manually or leave it on Auto to let mimoLive select the optimal codec based on connection and device capabilities.
- Enable Stereo & Reserve Bandwidth for High Quality Audio: Improves sound fidelity by using more bandwidth. Note: Changing this may temporarily disconnect the mimoCall partner.
- Partner Sees: Determines which video source, including the Program Output, the guest receives, defaults to
Program Output. - Partner Hears: Defines the mix the remote guest hears. Commonly set to
Program Mix (Mix-Minus). - Reconnect to Partner: Forces mimoLive to re-establish the mimoCall connection with the guest.
Use this if the video or audio stream freezes or becomes unstable.
Incoming
- Video Resolution: Shows the received video frame size, e.g.
1280 × 720. - Frame Rate (fps): The actual number of frames per second being received (e.g.
14.0 fps). - Codec: The video codec used (e.g.
H.264). - Bitrate: Displays the current and average bitrate, e.g.
2.5 Mbit/s (avg. 1.82 Mbit/s). - Data Transfer Graph: Shows real-time bandwidth usage for the last 60 seconds.
- Codec: Usually
opus, optimized for speech and variable network conditions. - Bitrate: Shows the current and average bitrate (e.g.
43.67 Kbit/s (avg. 37.89 Kbit/s)). - Graph: Displays bitrate changes over time.
- Connection Type: Typically displays
local, udporrelay, tcp, depending on the network conditions and connection path. - Local IP: The IP address and port used for the call, helpful for diagnosing network routing.
Outgoing
All the statistic values for the incoming side also applies to the outgoing data.