
The Source Performance Monitor can be opened by selecting Window > Source Performance Monitor, or by using the keyboard shortcut ⌘⌥S (Command–Option–S).
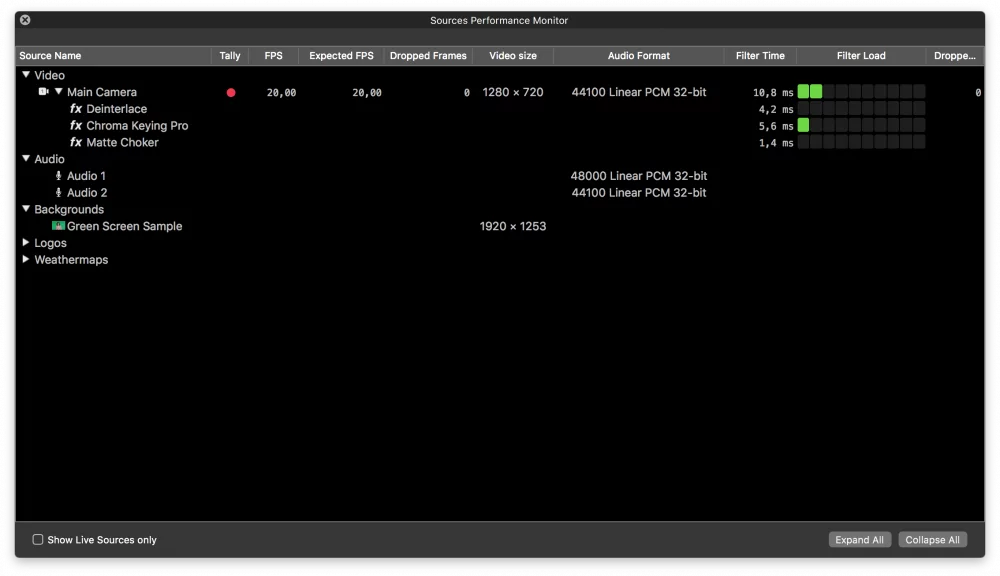
This window gives you an overview of all your sources, displaying a variety of performance data. For a typical video source, you can see the tally light state (Tally) (whether it is currently used for program output), the current frame rate (FPS) delivered from the video source to mimoLive, the expected frame rate (Expected FPS; reported by the video source itself), the number of Dropped Frames received from the source, and the Audio Format being used (if any).
If a video source uses filters, the monitor shows how much time each individual filter needs to compute its result (Filter Time). In the main row for that video source, you can also see the overall filter computation time.
All visual sources—such as video cameras, movies, or images—display their pixel dimensions (Video Size).
All audio sources display their audio format and sample rate.